GLOBAL WEATHER SYSTEMS
|
The complete world weather forecasting system |
||||||
| Home | Forums | Oceanography | Climatology | Geology | Learning | |


|
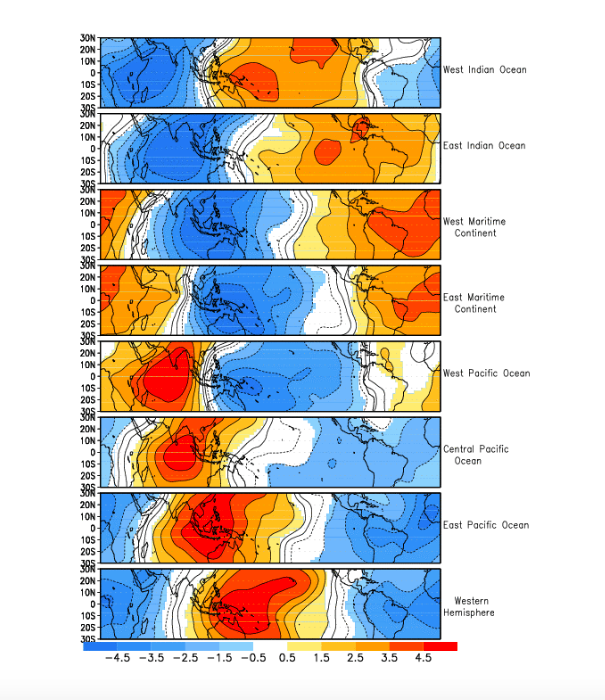
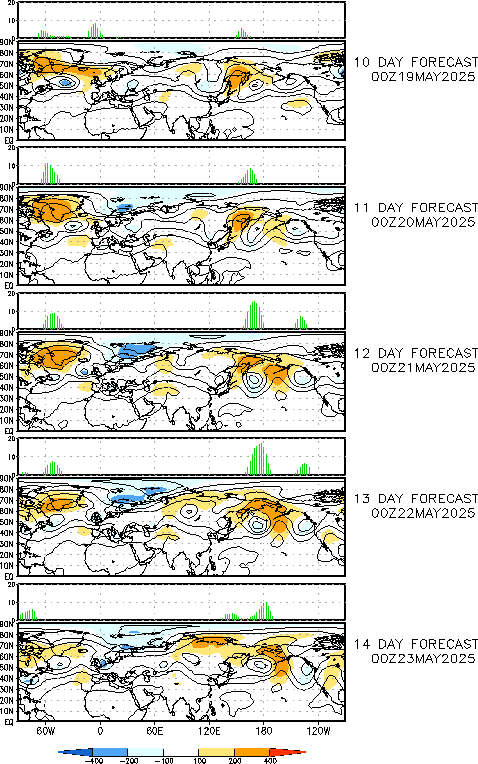
The Madden-Julian Oscillation measures the greatest area of convection (aka thunderstorms) in the world. Where you find those areas of convection cause ridges to form in the latitudes above it. The MJO phases are broken up into sections of the equator almost like ENSO (El Niño. La Nina ) has different regions (or basins). Each phase correlates to where the area of greatest convection is located (see below image).
|
|---|
|
MJO LAST 40 DAYS
MJO Operational GFS Phase Diagram
15 day Ensemble GFS Phase Diagram
European Centre for Medium Range Weather Forecasts MJO phase
Current conditions
MJO Statistical Models Phase Diagram
MJO Anomalies Constructed Analogue -- Spatial OLR Anomalies
Monitoring the recent evolution of storminess across both the Northern and Southern Hemisphere. Storm tracks are identified by tracking sea level pressure minima and the following pages highlight storm tracks and important related fields (precipitation, low-level wind vectors and magnitude, significant wave heights, and sea ice) for the past 10, 30, and 90 days. Storm tracks from the Global Forecast System (GFS) are also included. All data is provided courtesy of the Environmental Modeling Center (EMC) of the National Centers for Environmental Prediction (NCEP) as part of NOAA. p align="center">
|


Copyright © 2012 Global Weather Systems by Floodwarn